


When you first get a lab report back, it can feel like you've been handed a document written in a foreign language. It’s a wall of abbreviations, numbers, and medical jargon that looks intimidating, but the layout is actually more straightforward than you’d think.
Learning how to read your lab results really just comes down to knowing where to look. Once you get the hang of it, that confusing document turns into a clear snapshot of your health.
Your First Look at a Lab Report
Before you dive into the numbers, the very first thing you should do is confirm all your personal information. Make sure your name, date of birth, and the date the sample was collected are all correct. It sounds basic, but you’d be surprised how often mix-ups can happen. This simple check ensures you’re looking at your results from the right test.
Breaking Down the Core Components
With your details confirmed, you can shift your focus to the results themselves. The data is usually organized into a table with four key columns. Getting comfortable with these is the secret to making sense of everything.
Here's a quick summary of the essential parts and what each one means for you.
Key Parts of Your Lab Report
| Component | What It Tells You | Why It Matters |
|---|---|---|
| Test Name | This lists what was measured in your sample, like "Hemoglobin" or "Glucose." | It identifies the specific biomarker being evaluated. |
| Your Result | This is the specific numerical value from your blood, urine, or tissue sample. | This is your personal data point—the number that shows where you stand. |
| Units | This shows how the result was measured (e.g., mg/dL, g/dL). | It provides critical context for the number. A result of 100 means very different things depending on the unit. |
| Reference Range | This is the range of values considered normal for the general population. | This is the benchmark your result is compared against to see if it's high, low, or normal. |
Mastering these four columns is the foundation for understanding any lab report, whether it's a simple blood count or a complex hormone panel.
This infographic breaks down those essential sections to help you quickly identify what matters most on the page.
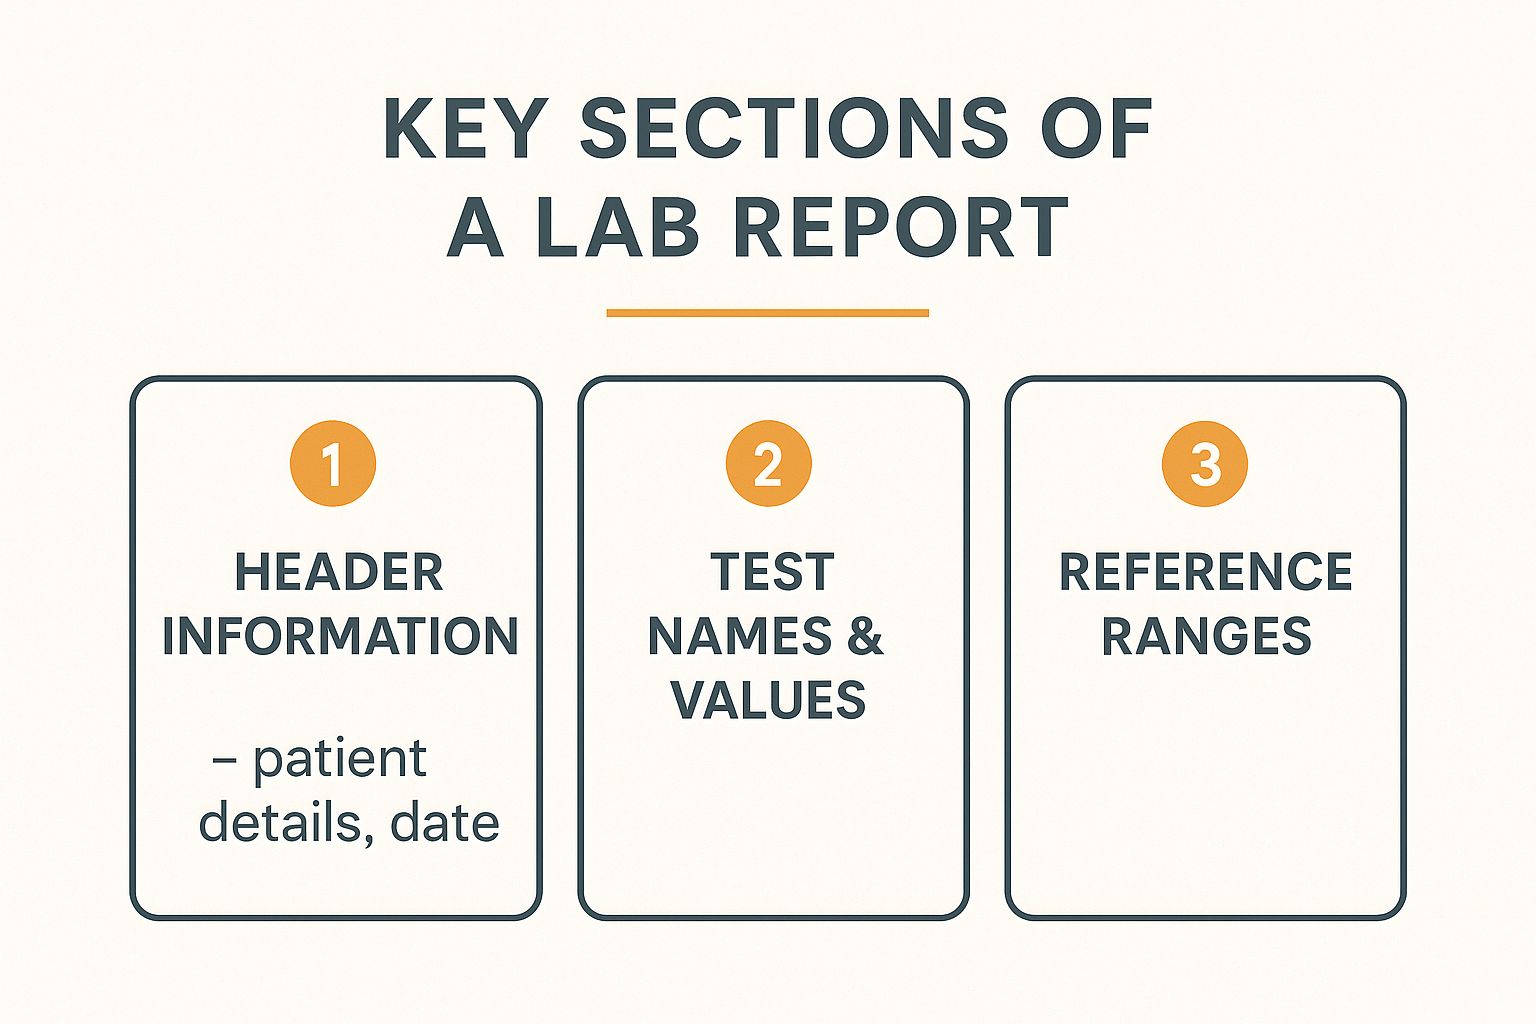
As you can see, the layout is designed to logically guide your eye from your personal details to the specific test values and their corresponding normal ranges.
Think of the reference range as the "normal" boundaries. If your result falls within this range, it’s generally considered fine. If it falls outside—either higher or lower—it gets flagged for a closer look.
It’s crucial to remember that these ranges are just statistical averages. A result that’s slightly outside the lines isn’t automatically a cause for panic. Factors like your age, gender, and even the specific equipment used by the lab can influence what's considered "normal."
This structure is designed to make it easy for you and your doctor to spot potential areas of concern at a glance. For a deeper dive into what specific tests measure, our detailed guide on lab tests and analysis offers more information. With this foundation, you'll be ready to start interpreting specific panels, like the CBC.
Decoding the Complete Blood Count (CBC)
If you've ever had routine blood work done, you've almost certainly had a Complete Blood Count, or CBC. This is one of the most fundamental tests in medicine, and for good reason—it gives a broad, valuable snapshot of your overall health. Think of it as a quick inventory of the different cells circulating in your bloodstream.
A CBC measures the three main types of blood cells: red blood cells, white blood cells, and platelets. Each one has a distinct and vital job, and their numbers can tell a story about everything from your energy levels to how well your immune system is holding up. Learning how to read a CBC is a great first step toward understanding your own health data.
Your Red Blood Cells: The Oxygen Carriers
The first group of markers you’ll likely see on a CBC report relates to your red blood cells (RBCs). These are the cells responsible for hauling oxygen from your lungs to every other part of your body. When you don't have enough healthy RBCs, your body can feel starved of energy.
There are three key measurements related to this process:
- Red Blood Cell (RBC) Count: This is the total number of red blood cells you have.
- Hemoglobin (Hgb): This is the protein inside your red blood cells that actually grabs onto and carries oxygen.
- Hematocrit (Hct): This measurement represents the percentage of your blood volume that is made up of red blood cells.
Low levels across these three areas often point toward anemia, which can cause that all-too-familiar fatigue, weakness, and shortness of breath. On the flip side, unusually high levels might suggest something like dehydration or other less common conditions that cause your body to produce too many red blood cells.
Here's a sample report showing the typical layout for these and other CBC components.
This example clearly shows the test name, the patient's result, the established reference range, and the units of measurement—just as we discussed.
Your White Blood Cells: The Immune Defenders
Next up is your White Blood Cell (WBC) count. These cells are the soldiers of your immune system, rushing to fight off infections from bacteria, viruses, and other invaders. A standard CBC gives you a total WBC count, but a "CBC with differential" breaks it down even further.
A differential is particularly useful because it shows the levels of the five major types of white blood cells:
- Neutrophils: These are the first responders to bacterial infections. High levels often mean your body is actively fighting one.
- Lymphocytes: These cells are key players against viral infections. Elevated lymphocytes might be seen with conditions like the flu or mono.
- Monocytes: This is the "clean-up crew," responsible for removing dead cells and debris.
- Eosinophils: Levels of these cells can rise in response to allergies or parasitic infections.
- Basophils: These are the least common type and are also involved in allergic responses.
A high total WBC count, known as leukocytosis, is a classic sign of infection. Conversely, a low count (leukopenia) could mean the immune system is compromised, which can be caused by certain medications or underlying health issues.
It's all about context. A runner who just finished a marathon might have temporarily elevated neutrophils from physical stress, not an infection. Your doctor's job is to connect these numbers to your personal health story.
Platelets: The Clotting Crew
Finally, the CBC measures your platelets. These are tiny cell fragments that play a critical role in blood clotting. When you get a cut, platelets rush to the site to form a plug and stop the bleeding.
A low platelet count (thrombocytopenia) can lead to easy bruising or excessive bleeding. A high count (thrombocytosis), on the other hand, could increase the risk of forming unnecessary blood clots. Both scenarios warrant a closer look by your healthcare provider to figure out the underlying cause.
The global clinical laboratory testing market is growing fast, expected to hit around $250 billion by 2025. This expansion is largely fueled by the rising prevalence of chronic conditions that demand regular diagnostic tests, underscoring just how central these results are to modern healthcare. You can discover more insights about the clinical testing market's growth and its drivers to see the bigger picture.
Understanding the components of a CBC is an empowering step. For those interested in optimizing their health through more advanced measures, exploring a variety of specialized lab tests can provide even deeper insights into your body's performance. With this knowledge, you are better prepared to have a productive discussion with your doctor about what your numbers mean for you.
Interpreting Your Metabolic Panel (CMP)
If the Complete Blood Count (CBC) gives you a headcount of your blood cells, the Comprehensive Metabolic Panel (CMP) pops the hood to check the engine. This panel is all about your body's chemical balance, metabolism, and how well crucial organs like your liver and kidneys are running. It's an incredibly powerful snapshot of how your body processes energy and keeps everything in equilibrium.
A CMP typically looks at 14 different markers, but don't let that number intimidate you. They fall into a few key groups. Learning how to read lab results from this panel isn't about memorizing every number; it's about seeing how they work together to tell a story about your internal health.

Blood Sugar and Electrolytes
The first part of a CMP usually tackles your blood glucose and electrolytes. These numbers are vital for everything from the energy you have right now to the basic function of your nerves and muscles.
Your glucose level is a direct measurement of the sugar in your blood at the moment of the test. A fasting glucose test is one of the most common ways to screen for prediabetes and diabetes. A high result could mean your body isn't using insulin properly, while a low result (hypoglycemia) might be the reason you've been feeling dizzy or fatigued.
Next up are the electrolytes, which are minerals carrying an electric charge. They're critical for hydration, nerve signals, and keeping your body's pH balanced.
- Sodium (Na): A key player in fluid balance and nerve function. Your hydration status, diet, and kidney health can all push this number up or down.
- Potassium (K): Absolutely essential for muscle contractions, including your heart. Both high and low levels can be serious and need a doctor's attention.
- Chloride (Cl): This mineral works hand-in-hand with sodium to maintain fluid balance, so its levels often rise and fall in tandem with sodium.
- Carbon Dioxide (CO2/Bicarbonate): Helps maintain your body's acid-base (pH) balance.
An electrolyte imbalance can pop up for many reasons, like dehydration, certain medications, or an underlying kidney issue. For example, someone with a nasty bout of diarrhea might have low potassium and sodium, which explains the weakness and muscle cramps they're feeling.
Kidney Function Markers
The CMP gives you a direct look at how well your kidneys are filtering waste out of your blood. The two most important markers here are BUN and creatinine.
Blood Urea Nitrogen (BUN) measures urea nitrogen, a waste product from protein breakdown. If this number is elevated, it could be a red flag for dehydration or a sign that your kidneys are struggling.
Creatinine is another waste product, this one generated from normal muscle wear and tear. Healthy kidneys filter it out like champs. A high creatinine level is often a more specific signal that your kidneys aren't working as well as they should.
Your lab report might also include a BUN/Creatinine Ratio and an Estimated Glomerular Filtration Rate (eGFR). The eGFR is a calculation using your creatinine, age, and gender, giving a much clearer picture of your overall kidney filtration capacity. A lower eGFR points toward poorer kidney function.
Think of your kidneys as a sophisticated coffee filter. BUN and creatinine are like used coffee grounds. If the filter gets clogged, the grounds start to build up in the pot—which, in this case, is your bloodstream.
Liver Function Tests
The final part of the CMP is a report card for your liver, measuring specific proteins and enzymes it produces. Your liver is a workhorse, responsible for detoxifying your blood, making proteins, and metabolizing nutrients.
The key liver enzymes to watch are:
- Alanine Aminotransferase (ALT): This enzyme is found mostly in the liver. When liver cells get damaged, they release ALT into the blood, making it a very sensitive marker for liver inflammation or injury.
- Aspartate Aminotransferase (AST): Found in the liver, but also in the heart and muscles. High AST can also point to liver damage, but it's less specific than ALT.
- Alkaline Phosphatase (ALP): An enzyme found in the liver, bile ducts, and even bone. Elevated levels can suggest issues with the liver or bile ducts, or sometimes bone disorders.
The CMP also looks at proteins made by the liver, like Albumin and Total Protein, as well as Bilirubin, a waste product from breaking down old red blood cells. Abnormal levels here can signal liver disease, bile duct blockages, or other issues. For instance, someone with a history of chronic alcohol use might show elevated ALT and AST, flagging potential liver stress long before any major symptoms appear.
Decoding Your Cholesterol (Lipid Panel)
When your doctor brings up heart health, the conversation almost always lands on cholesterol. The test that gives you the inside scoop is called a lipid panel, and it's far more than just a single number. It actually measures a whole group of fats circulating in your blood, giving you a detailed snapshot of your risk for cardiovascular disease. Learning how to read this report helps you understand the story your cholesterol is telling.
Think of these numbers as a direct report on the health of your arteries. When certain fats get too high, they can lead to plaque buildup—a condition called atherosclerosis. This nasty stuff narrows your arteries and can eventually trigger a heart attack or stroke, which is why the lipid panel is such a cornerstone of preventive care.
Good vs. Bad Cholesterol: The Story of LDL and HDL
The two most famous players in any lipid panel are LDL and HDL cholesterol. You've probably heard them called "bad" and "good" cholesterol, and for very good reason. Getting a handle on their different jobs is the first step to making sense of your results.
Low-Density Lipoprotein (LDL) is the "bad" guy. Picture it as a delivery truck that’s a bit reckless. Its job is to transport cholesterol to your cells, but when you have too much LDL, it starts dropping its cargo inside your arteries, contributing directly to that dangerous plaque. For LDL, a lower number is always the goal.
High-Density Lipoprotein (HDL) is the "good" cholesterol—think of it as the artery's cleanup crew. HDL's mission is to patrol your arteries, scoop up excess cholesterol, and haul it back to the liver to be disposed of. A higher HDL number is protective, so in this case, more is definitely better.
Putting It All Together: Total Cholesterol and Triglycerides
Beyond the good and the bad, your lipid panel includes two other critical numbers that complete the picture of your cardiovascular risk: Total Cholesterol and Triglycerides.
Your Total Cholesterol is exactly what it sounds like: a combined measure of your LDL, HDL, and a few other lipid components. While it gives you a quick overview, doctors are usually much more interested in the breakdown. For instance, two people could have the same "high" total cholesterol number, but one might have sky-high LDL while the other has exceptionally high (and protective) HDL. Those two scenarios represent completely different risk levels.
Triglycerides are another type of fat in your blood that your body uses for energy. High triglycerides, often linked to diets heavy in sugar and refined carbs, are another major red flag for heart disease.
Here’s a quick cheat sheet for what you’re looking at:
| Lipid Component | Ideal Level (General Guideline) | What It Means |
|---|---|---|
| LDL Cholesterol | Below 100 mg/dL | Lower is better. This is the main source of plaque in your arteries. |
| HDL Cholesterol | Above 60 mg/dL | Higher is better. This "good" cholesterol helps clear out the bad stuff. |
| Triglycerides | Below 150 mg/dL | High levels, often from diet, increase your risk for heart disease. |
| Total Cholesterol | Below 200 mg/dL | A summary number of all the cholesterol types in your blood. |
Now, it's critical to remember that these are just general guidelines. Your doctor will interpret your results in the context of your personal health, family history, and other risk factors like high blood pressure or diabetes.
A scenario I see all the time is someone with slightly elevated LDL but very high HDL. In that situation, a doctor might be less concerned because the high level of "good" cholesterol is actively working to offset the "bad," effectively balancing out the risk.
The focus on these tests is only growing. The clinical laboratory tests market is projected to hit USD 213.04 billion by 2030, driven by the rising tide of chronic illnesses like cardiovascular disease. To put that in perspective, heart disease was responsible for an estimated 17.9 million deaths across the globe in 2021. You can read the full research about these market dynamics to see why understanding lab results has become so crucial for public health.
At the end of the day, your lipid panel is a powerful tool. It doesn’t just flag a problem—it gives you the roadmap you need to make proactive changes, from diet and exercise to medication, that can directly protect your heart for the long haul.
Alright, you’ve waded through the abbreviations and reference ranges, and you’ve got a handle on what your lab report is saying. So, what now? This is where you shift from just reading your results to actively using them as a tool for your health.
The first and most important thing to do is simple: don't panic. It's incredibly common to see a number flagged as slightly high or low and immediately jump to the worst-case scenario. But remember, your body isn't a static machine. Dozens of factors—from what you ate for breakfast to how well you slept the night before—can cause minor, temporary blips in your lab values. A single result outside the "normal" range is a data point, not a diagnosis.
Prepare for a Productive Doctor's Visit
Think of your lab results as the perfect conversation starter for a meaningful chat with your doctor. Instead of just waiting for them to tell you what it all means, you can walk into your appointment ready to be an active participant. This is your chance to turn that raw data into a real action plan.
To get the most out of your visit, take a few minutes to jot down specific questions beforehand. Being prepared helps guarantee you’ll leave the office with clarity and a solid game plan.
Try asking questions like these:
- "My [specific value, e.g., glucose] was flagged as a bit high. What do you think that means in the context of my overall health?"
- "You mentioned this result is borderline. Are there any lifestyle changes, like diet or exercise, you'd recommend to help improve this number?"
- "Should we re-test this marker in a few months to see if it was just a fluke or if it’s a consistent trend?"
- "How does this one result fit in with my other lab values and my personal health history?"
The goal is to shift your appointment from a passive experience into a collaborative one. You bring your knowledge of your own body and daily life; your doctor brings their medical expertise. Together, you can build a much more complete picture of your health.
Understanding the Bigger Picture
It’s crucial to remember that your doctor is interpreting your results within a much broader context. They’re looking at the whole story—not just one chapter. This includes your age, gender, family history, current symptoms, medications you’re taking, and trends from previous labs. A slightly elevated liver enzyme might mean one thing for a marathon runner and something completely different for someone with a family history of liver disease.
This holistic view is precisely why trying to self-diagnose from a single lab report can be so misleading. Your provider is trained to connect the dots and spot patterns that just aren't obvious on paper.
The field of diagnostics itself is constantly evolving to provide an even clearer picture. The clinical laboratory tests market is a testament to this, valued at around USD 136.72 billion by 2025 and projected to soar past USD 301.87 billion by 2034. This growth is driven by innovations that lead to more precise and faster results, ultimately helping doctors and patients make better-informed decisions. You can learn more about these key market findings to see how technology is improving our ability to read lab results across the globe.
Taking Action and Following Up
Based on your conversation, your doctor will lay out the next steps. This could be anything from simple lifestyle tweaks to more specific interventions.
Here are some common follow-up actions you might discuss:
- Lifestyle Modifications: Your provider might suggest changes to your diet, exercise routine, sleep habits, or stress management techniques.
- Further Testing: If a result is inconclusive or points toward a potential issue, they may order a more specific test to gather more information.
- Medication or Treatment: For certain conditions, a prescription might be necessary. This is especially true when managing hormone levels, which often require very specific protocols. If your results point toward hormonal imbalances, it's helpful to understand the proper administration of treatments; for instance, you can review our guide on how to use Somatropin for more details on that process.
- Watchful Waiting: For borderline results, sometimes the best course of action is simply to monitor the situation. Your doctor may schedule a follow-up test in a few months to track any changes.
By taking these steps, you transform your lab report from a confusing piece of paper into a powerful roadmap for optimizing your health.
Common Questions About Lab Results
Even after you start getting the hang of reading a lab report, it’s natural to have a few nagging questions. Seeing your health spelled out in numbers can bring up a lot of "what ifs."
Let's tackle some of the most common concerns I hear from people. The goal here is to give you straightforward answers, cut down on the anxiety, and help you feel more confident in this process.
What Does a 'Flagged' Result Really Mean?
Seeing a result marked with an 'H' for high or an 'L' for low can be jarring, but it’s rarely an automatic cause for panic. A flagged result simply means your number fell outside the standard reference range that particular lab uses.
Think of it this way: that range represents the typical values for about 95% of the healthy population. By definition, that means 5% of perfectly healthy people will have results that fall slightly outside this so-called "normal" window. A single flagged marker is often just a statistical blip or a temporary fluctuation. Your doctor’s job is to figure out if that flag is a meaningful signal or just noise.
A flagged result is an invitation for a closer look, not a definitive diagnosis. It prompts your doctor to consider your overall health picture—your symptoms, history, and other test values—to decide what, if any, next steps are needed.
For instance, a slightly high glucose reading could easily be from the sugary snack you had before the test. Slightly elevated white blood cells? That might just mean your body was fighting off a minor cold you didn't even notice.
Why Do Reference Ranges Vary Between Labs?
You might notice that the "normal" range on a report from one lab is a little different from another. This is perfectly normal and happens for a few key reasons.
Different labs may use different equipment, testing methods, or even chemical reagents to analyze your sample. These subtle variations can produce slightly different results, so each lab establishes its own reference ranges based on its specific processes and the local population it serves. This is exactly why you have to use the range provided on your specific report to interpret your numbers. Never compare a result from Lab A to the reference range from Lab B.
How Often Should I Get Lab Work Done?
The ideal frequency for lab tests depends entirely on you—your age, personal health history, family history, and any existing conditions all play a role. There's no single right answer.
- For healthy adults with no chronic conditions: A routine check-up with basic panels like a CBC and CMP every one to two years is often plenty.
- For individuals managing a chronic condition: If you have something like diabetes, high cholesterol, or a thyroid disorder, your doctor will likely want to test more often (say, every three to six months) to monitor your condition and fine-tune your treatment.
- For those on specific therapies: People undergoing treatments like Hormone Replacement Therapy (TRT) need regular monitoring to ensure their levels are both optimized and safe.
The best approach is always a direct conversation with your healthcare provider. They can recommend a testing schedule that makes sense for your personal health needs and goals.
Can My Lifestyle Really Change These Numbers?
Absolutely. In fact, this is one of the most empowering things about understanding your results. Many of the key markers on your lab reports are incredibly responsive to changes in your lifestyle, giving you a clear roadmap for making a real impact.
It’s not just theory; it’s direct feedback.
- Diet: Slashing your intake of sugar and refined carbs can directly lower your glucose and triglyceride levels.
- Exercise: Regular physical activity is fantastic for boosting your HDL ("good") cholesterol and improving insulin sensitivity.
- Sleep: Getting enough quality sleep helps regulate hormones like cortisol, which has a ripple effect across multiple systems.
- Stress Management: Chronic stress can elevate inflammation markers and blood pressure. You'll see it in the numbers.
Your lab results turn abstract wellness advice into concrete, measurable data, showing you exactly how your daily habits are affecting your health on the inside.
At Elite Bioscience, we believe in empowering you with the knowledge and tools to take control of your health. Our tailored therapies are designed to help you optimize your body's performance, backed by clear guidance and support. Explore our services today at https://elitebioscience.co.